Google Data Analytics Professional Certificate - Part 1
This is part of a series of posts on the Google Data Analytics course from Coursera. It is not meant to be a review of the course nor by any means an extensive overview of its content. This is intended to be short and incorporate only the main concepts and learnings I gathered from each module. My purpose for these blog posts is mainly to consolidate what I learned from the course and also an attempt to help anyone who might be interested in reading a little bit about these subjects/this course.
In this post you will find a mix of direct content from the course, my own personal notes and also some extrapolations and additions I made wherever I felt the need to add information.
Foundations: Data, Data, Everywhere
Transforming data into insights
→ The six steps of the data analysis process that this program teaches are: ask, prepare, process, analyze, share, and act. These six steps can help to break the data analysis process into smaller, manageable parts, which is called structured thinking. This kind of process involves four basic activities:
Recognizing the current problem or situation
Organizing available information
Revealing gaps and opportunities
Identifying your options
→ The six steps mentioned above can be applied to any data analysis and are outlined as follows:
Step 1: Ask questions and define the problem
It’s impossible to solve a problem if you don’t know what it is. Things to consider here:
Define the problem you’re trying to solve;
Make sure you fully understand the stakeholder’s expectations;
Focus on the actual problem and avoid any distractions;
Collaborate with stakeholders and keep an open line of communication;
Take a step back and see the whole situation in context.
Questions to ask yourself in this step:
What are my stakeholders saying their problems are?
Now that I’ve identified the issues, how can I help the stakeholders resolve their questions?
Step 2: Prepare data by collecting and storing the information
You will decide what data you need to collect in order to answer your questions and how to organize it so that it is useful. You might use your business task to decide:
What metrics to measure;
Locate data in your database;
Create security measures to protect that data.
Questions to ask yourself in this step:
What do I need to figure out how to solve this problem?
What research do I need to do?
Step 3: Process data by cleaning and checking the information
You will need to clean up your data to get rid of any possible errors, inaccuracies, or inconsistencies. This might mean:
Using spreadsheet functions to find incorrectly entered data;
Using SQL functions to check for extra spaces;
Removing repeated entries;
Checking as much as possible for bias in the data.
Questions to ask yourself in this step:
What data errors or inaccuracies might get in my way of getting the best possible answer to the problem I am trying to solve?
How can I clean my data so the information I have is more consistent?
Step 4: Analyse data to find patterns, relationships, and trends
You will want to think analytically about your data. At this stage, you might sort and format your data to make it easier to:
Perform calculations;
Combine data from multiple sources;
Create tables with your results.
Questions to ask yourself in this step:
What story is my data telling me?
How will my data help me solve this problem?
Who needs my company’s product or service? What type of person is most likely to use it?
Step 5: Share data with your audience
Everyone shares their results differently so be sure to summarise your results with clear and enticing visuals of your analysis using data via tools like graphs or dashboards. This is your chance to show the stakeholders you have solved their problem and how you got there. Sharing will certainly help the team:
Make better decisions;
Make more informed decisions;
Lead to stronger outcomes;
Successfully communicate your findings.
Questions to ask yourself in this step:
How can I make what I present to the stakeholders engaging and easy to understand?
What would help me understand this if I were the listener?
Step 6: Act on the data and use the analysis results
Now it’s time to act on the data. This will take everything learned from the data analysis and put it to use, which could mean providing stakeholders with recommendations based on the findings so they can make data-driven decisions. Questions to ask yourself in this step:
- How can I use the feedback I received during the share phase (step 5) to actually meet the stakeholder’s needs and expectations?
Understanding the data ecosystem
→ An ecosystem is a group of elements that interact with one another. Data ecosystems are made up of various elements that interact with one another in order to:
Produce data;
Manage data;
Store data;
Organize data;
Analyse data;
Share data.
→ Data Analysis vs Data Science:
Data analysis and data science are related fields, but they have some distinct differences.
Data analysis typically refers to the process of cleaning, modeling, and analyzing data in order to extract useful information and insights. This can involve using techniques from statistics and machine learning to discover patterns and relationships in the data, and to make predictions or decisions. The goal of data analysis is often to understand a specific problem or question and to communicate the results of the analysis to others.
Data science, on the other hand, is a broader field that encompasses data analysis as well as the collection, cleaning, and preparation of data, as well as the development of models and algorithms that can be used to extract insights from the data. Data science also tends to involve more interdisciplinary work, and draws on concepts and techniques from a wide range of fields, including computer science, statistics, and domain-specific expertise. The goal of data science is often to extract knowledge or insights that can inform decisions or actions in some way.
In summary, data analysis is a specific aspect of data science that involves the modeling and understanding of data, while data science is a more interdisciplinary field that encompasses the full process of working with data.
Data analyst skills
→ The five key data analytst skills are the following:
Curiosity: desire to know more about something by asking the right questions;
Understanding context: understanding where information fits into the big picture;
Having a technical mindset: breaking big things into smaller steps;
Data design: how to organize data and information;
Data strategy: people, processes, and tools in data analysis.
Thinking about analytical thinking
→ Analytical thinking involves identifying and defining a problem and then solving it by using data in an organized, step-by-step manner. The five key aspects to analytical thinking are:
Visualisation: graphical representation of information;
Strategy: what we want to achieve with the data and how to get there;
Problem-orientation: like some relationship between data;
Correlation: looking at the complete puzzle — what is the context and general plan;
Big-picture and detail-oriented thinking: the pieces that make the puzzle — all the aspects that help in executing the plan.
→ The Five Whys process is a simple way to wrap your head around root causes. In the Five Whys you ask "why" five times to reveal the root cause. The fifth and final answer should give you some useful and sometimes surprising insights.
Follow the data life cycle
→ A general overview of the life cycle of data is:
Plan: decide what kind of data is needed, how it will be managed, and who will be responsible for it;
Capture: collect or bring in data from a variety of different sources;
Manage: care for and maintain the data, this includes determining how and where it is stored and the tools used to do so;
Analyse: use the data to solve problems, make decisions, and support business goals;
Archive: keep relevant data stored for long-term and future reference;
Destroy: remove data from storage and delete any shared copies of the data.
Outlining the data analysis process
Regardless of what type of data analysis you're conducting, the process is generally the same. The first thing you want to do is ASK. You want to ask all of the right questions at the beginning of the engagement so that you better understand what your leaders and stakeholders need from this analysis. What is the problem that we're trying to solve? What is the purpose of this analysis? What are we hoping to learn from it?
After you've asked all the right questions and you've wrapped your arms around the scope of the analysis you need to conduct, the next step is to PREPARE. We need to be thinking about what type of data we need to answer those key questions. This could be anything from quantitative data or qualitative data. It could be cross-sectional or points in time versus longitudinal over a long period of time. We need to be thinking about the type of data we need in order to answer the questions that we've set out to answer based on what we learned when we asked the right questions. We also need to be thinking about how we're going to collect that data or if we need to collect that data. It may be the case that we need to collect this data brand-new. So we need to think about what type of data we're going to be collecting and how.
After all the hard work to collect the data, now you need to PROCESS that data. It begins with cleaning. We can think of it as the initial introduction or the handshake, hello, to your data. This is where you get a chance to understand its structure, its quirks, its nuances, and you really get a chance to understand deeply what type of data you're going to be working with and understanding what potential that data has to answer all of your questions. This is such an important part, too, where we're running through all of our quality assurance checks. For example, do we have all of the data that we anticipated we would have? Are we missing data at random or is it missing in a systematic way such that maybe something went wrong with our data collection effort? If needed, did we code all of our data the right way? Are there any outliers that we need to treat differently? This is the part where we spend a lot of time really digging deeply into the structure and nuance of the data to make sure that you're able to analyze it appropriately and responsibly.
After cleaning our data and running all of our quality assurance checks, now is the point where we ANALYSE our data, making sure to do so in as objective and unbiased a way as possible. To do this, the first thing we do is run through a series of analyses that we've already planned ahead of time based on the questions that we know we want to answer from the very, very beginning of the process. One thing that's probably the hardest about this particular process, the hardest thing about analyzing data, is that we as analysts are trained to look for patterns. Over time as we become better and better at our jobs, what we'll often find is that we can start to intuit what we might see in the data. We might have a sneaking suspicion as to what the data are going to tell us. This is the point where we have to take a step back and let the data speak for itself. As data analysts, we are storytellers, but we also have to keep in mind that it is not our story to tell. That story belongs to the data, and it is our job as analysts to amplify and tell that story in as unbiased and objective a way as possible.
The next step is to SHARE all of the data and insights that you've generated from your analyses. All of this work from asking the right questions to collecting your data, to analyzing and sharing, doesn't mean much of anything if we aren't taking action on what we've just learned. This is where we use all of those data-driven insights to decide what types of interventions we want to introduce, not only at the organizational level, but also at the team level as well.

Figure from the Google Data Analytics course on Coursera.
The data analysis toolbox
→ The three key data analyst tools are:
Spreadsheets
Query languages
Visualisation tools
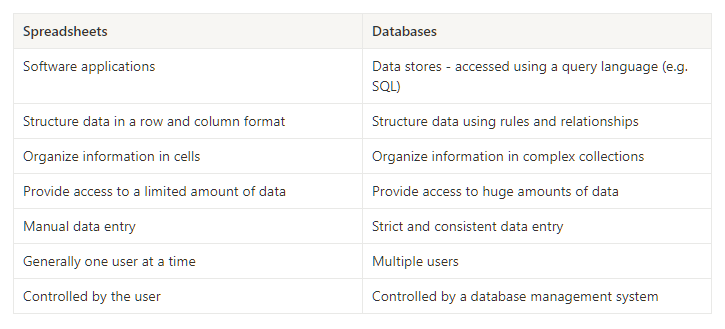
→ Spreadsheets and databases both offer ways to store, manage, and use data. The basic content for both tools are sets of values. Yet, there are some key differences, too:

Structured Query Language (SQL)
→ Just as humans use different languages to communicate with others, so do computers. SQL enables data analysts to talk to their databases. SQL is one of the most useful data analyst tools, especially when working with large datasets in tables. It can help you investigate huge databases, track down text (referred to as strings) and numbers, and filter for the exact kind of data you need, much faster than a spreadsheet can.
→ A query is a request for data or information from a database. When you query databases, you use SQL to communicate your question or request. You and the database can always exchange information as long as you speak the same language.
→ Every programming language, including SQL, follows a unique set of guidelines known as syntax. Syntax is the predetermined structure of a language that includes all required words, symbols, and punctuation, as well as their proper placement. As soon as you enter your search criteria using the correct syntax, the query starts working to pull the data you’ve requested from the target database. The base syntax of every SQL query is the same:
Use SELECT to choose the columns you want to return
Use FROM to choose the tables where the columns you want are located
Use WHERE to filter for certain information
→ Regarding the SQL content, both from this module and from later ones, I didn’t take many notes because I have already done Udacity’s course ‘SQL for Data Analysis’, which is a very good course on the topic, and I took an extensive amount of notes from it so I felt no need to do the same here. I do plan on writing some blog posts soon that cover that course.
Data analyst job opportunities
→ The data analyst role is one of many job titles that contain the word “analyst.” To name a few others that sound similar but may not be the same role:
Business analyst — analyses data to help businesses improve processes, products, or services;
Data analytics consultant — analyzes the systems and models for using data;
Data engineer — prepares and integrates data from different sources for analytical use;
Data scientist — uses expert skills in technology and social science to find trends through data analysis;
Data specialist — organises or converts data for use in databases or software systems;
Operations analyst — analyzes data to assess the performance of business operations and workflows.
→ Data analysts, data scientists, and data specialists sound very similar but focus on different tasks. As you start to browse job listings online, you might notice that companies’ job descriptions seem to combine these roles or look for candidates who may have overlapping skills. The fact that companies often blur the lines between them means that you should take special care when reading the job descriptions and the skills required. The table below illustrates some of the overlap and distinctions between them:
.png)
Figure from the Google Data Analytics course on Coursera.
→ Other industry-specific specialist positions that you might come across in your data analyst job search include:
Marketing analyst — analyses market conditions to assess the potential sales of products and services;
HR/payroll analyst — analyses payroll data for inefficiencies and errors;
Financial analyst — analyses financial status by collecting, monitoring, and reviewing data;
Risk analyst — analyses financial documents, economic conditions, and client data to help companies determine the level of risk involved in making a particular business decision;
Healthcare analyst — analyses medical data to improve the business aspect of hospitals and medical facilities.
That’s it for the first part of the Google Data Analytics course from Coursera. Soon I’ll be posting the following parts of the course and I also intend to write some more posts on other courses I took (SQL and Python so far), some detailed notes I took (and continue to take) from subjects like data visualisation and probably some short book summaries of my favourite books, with the best quotes and key concepts.
As I mentioned in the beginning, this is mainly with the goal of consolidating all topics I’m interested in learning and also having all of it well structured and put together in one place (this website). So if you find this kind of content useful and wish to read some more, you can follow me on Medium just so you know whenever I post more stuff.


